|
Search DSS Finding Data Analyzing Data Citing data About Us DSS lab consultation schedule (Monday-Friday)
*No appts. necessary during walk-in hrs. Note: the DSS lab is open as long as Firestone is open, no appointments necessary to use the lab computers for your own analysis.  
|
Home How to Use a CodebookThese instructions explain what information you should look for when using a codebook, as well as how to translate the information in the codebook to the statements you will need to write SAS, SPSS, or Stata programs to read and analyze the data. Before looking for a codebook, you first need to determine if you actually need the data, or if you just need the results of the study, i.e., how many people live in New York. Sometimes you won't need the data at all, you can just use one of the many statistical reports or abstracts available in the library. If, in fact, you do need the data to do analyses, then you need to find a study or studies that investigated what you are looking at and carefully read the codebook to make sure that the study has the kind of data you need. Data Files
Since a codebook describes data files, it would be useful at this point to
discuss what data files are and the many formats in which they come. A data
file is simply a computer file that has data in it. Most data files are
arranged like spreadsheets where you have lines of information from each
observation (a person, a state, or a company) and columns of information
representing different variables. The main difference between a spreadsheet
and a data file is that each column in a spreadsheet is equal to one variable
in a data file. Each variable of a data file is made up of one or more
columns. Sometimes the data file will have spaces between the groups of
columns that make up a variable, but most times it will simply run everything
together. Here is a sample spreadsheet: Here is what the same information might look like in a data file: 12345678901234 123123.4 190 243 32.5 12 355 11.9383843 412 99 239 567123 4345 698 45.7 23 733 22.5 2 856 12 0 The first line of numbers isn't actually part of the data, we've put it there so you can see how the columns in a data file relate to the columns in a spreadsheet. In this example, column A in the spreadsheet is column 1 in the data file, column B is columns 2-3, column C is columns 4-8, and column D is columns 9-14. If you look closely, you can see that the actual numbers and letters are the same in both files. Since the information in the data file are all run together you need some way of determining where one variable ends and the next one starts. This, among many other important things, is found in the codebook. This is the simplest format of a data file and most will come like this. The two examples above have one "line," "record," or "card" of data for each observation. Often, though, a data file will have more than one line of data for each observation. This is a hold-over from the early days of computing when all the data were entered on punch cards which had only 80 columns. If a survey had more questions than could fit on one card, then researchers had to continue the data on another card. This is particularly true for files that have information from the same observation for several years. Here is an example: 1 1991 12123 1 1992 45 34 1 1993 63 88 2 1991 34678 2 1992 55456 2 1993 76 44 3 1991 44234 3 1992 32 56 3 1993 67 55 This file is very much like the one above, except that each observation has three lines in the file rather than just one. The information in a specific column or columns may or may not represent the same variable. If questions were dropped or added in subsequent years, then the information will be different. Also, if it is an old data file, then it is likely that each card is just a continuation of data from the same time period. A corollary to multiple cards is hierarchical files. Hierarchical files typically have just one line of data for each observation, however, each line may represent varying levels of information. Perhaps the best example of a hierarchical file is the Current Population Survey. In the CPS file there are three types of records or lines: Household records have information that is common to everyone who lives in that household; Family records have information that is common to everyone in a particular family in that household (more than one family can live in a household); and Person records have, of course, information pertaining to one specific person in that family. All of this information is contained in one file. The household record is always first, followed by the family record, and finally the person record. Each line in the file has a variable or column denoting what type of record it is. Here is an example of what a hierarchical file might look like: H 12 321 F 32 5 3 P 45 1 5 P 66 7 3 P 76 9 7 H 45 9 9 F678 3 5 F567 4 6 P8992187 P689 3 0 P66567 9 P554 5 9 P 89 8 9 Hierarchical files can be very tricky to program. If you need to analyze a hierarchical file, you should come to the DSS lab and speak with a consultant about how to do so. Of course, all of these examples have just a few variables, whereas a real data file will have many, many more.
CodebooksNow that we know what a data file is, we can make more sense out of what a codebook is. A codebook is a technical description of the data that was collected for a particular purpose. It describes how the data are arranged in the computer file or files, what the various numbers and letters mean, and any special instructions on how to use the data properly. Like any other kind of "book," some codebooks are better than others. The best codebooks have:
Even though a codebook has (or at least, should have) all of this information, not all codebooks will arrange it in the same manner. Later in this document we will show you what information you will need to write the program to read the data. Before you decide on a particular dataset, there are some things you need to verify before you can make good use of the data:
Once you have determined that a data file has what you want, you can begin the task of writing the program that will extract or subset those variables in which you are interested. The choice of which software package to use is up to you. You should be aware, however, that most of Princeton's data collection is accessible only on PUCC which has only SAS and SPSS. In any case, it is always a good idea to talk to a Consultant before you try extracting the data. Writing the ProgramBefore you can write the program, you will need to be able to locate this information about each variable you will want to use:
For examples please click here Coding when there is just one line of data for each observation:
In many instances, the data file will have one record per observation.
In these instances, you will only need to know the column locations of the
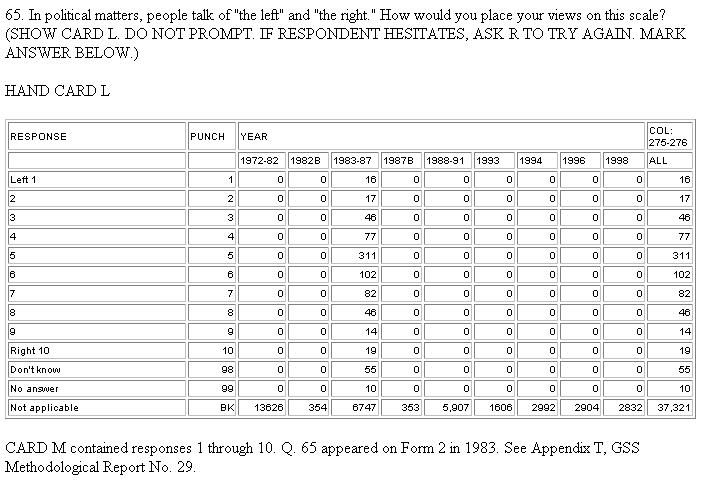
variables you want. Here are two examples from the General Social Survey
Codebook:
Although this codebook gives a name to the variable (partyid), not all codebooks do. Sometimes the variables are simply numbered. You do not always have to use the names or numbers provided as your own variable names, however, using the ones provided will make referring to the codebook later on much easier. This is important if you thought a variable should have only two categories of responses, but five show up in the data; you may have programmed the wrong columns or lines. It also allows comparison of results of analyses conducted on the same data by different researchers. Sometimes, the names provided are not allowable in whatever statistical package you are using because they are too long or have special characters in them. In these cases, you should refer to the user manual of whatever package you are using to determine what names are permissible. If you do change the variable names, be sure to make a list of these changes.
Often, a variable must have more than one column, such as a person's age.
Here is an example of a variable that takes more than one column:
If the variable were to have more than two columns, you would simply specify the beginning and ending columns indicated. Sometimes, the codebook will tell you in which column the variable begins and how many columns it occupies (also referred to as its "length"). Look at this example from the Current Population Survey : D A-WKSLK 2 97 (00:99) Item 22C - 1) How many weeks has ... been looking for work 2) How many weeks ago did ...start looking 3) How many weeks ago was ...laid offIt says that A-WKSLK is numeric, begins in column 97 and has a length of 2 (the instructions in the codebook explains this). In terms of the first example, that means this variable can be found in columns 97-98. Character variables would be indicated the same way. You can write the statements to read these variables like the ones above (a_wkslk 97-98), but if you have many variables, it would be time-consuming to calculate all the specific columns. Instead, you could do it like this:
You can readily see the similarities and differences among these. In all, the "2" refers to the number of columns the variable occupies in the data file, not necessarily how many digits there are in the variable (some columns may be blank). This is especially important if your data has decimals. For example, if a variable called "varname" were to have a length of 5 and 2 decimal places in it, then the coding would be as follows:
This means that "varname" occupies a total of five columns in the data file. Two of those columns are the numbers on the right of the decimal, one is the decimal itself, and the last two columns are the numbers on the left of the decimal. Therefore, the largest number that could be coded into this space is 99.99. Once in a while, a codebook will tell you that there are "implied" decimal places. This means that the decimal was not actually entered into the data and you must assume (and correctly program) that the last however many digits are on the right of the decimal. Coding for more than one line of data for each observation:You need to pay special attention to how many lines there are for each observation, and on what line the variable you are interested in can be found. Every codebook will indicate what line the variable can be found differently, so you must look in the introductory pages to see how this is done. Failure to keep track of what line the variable is on will result in reading from the wrong line and thus, reading the wrong information for that variable. Let's assume that in Example 2 above, there are five lines of data for each observation. Let's further assume that varname is found on the first line for an observation and that charname is found on the third line. Here are the statements you would need to read these variables:
As you can see, in each program you need to tell the program how many lines there are for each observation ("n=5", "lines=5", and "_lines(5) ). Each program also has a different way of identifying which line you want to read ("#1", /1 , "_line(1)" ). If you wanted to read other variables from lines 1 or 3, you could simply list them together without repeating the line pointer for each variable. The program will continue reading from the same line of data until you tell it to go to the next line. For info on how to read data in ASCII format using data layout click here ConclusionThis has been a brief and very general introduction to data files and codebooks. We could not possibly cover everything you might encounter in using a codebook. So, if you do find something you don't understand, ask a consultant! |